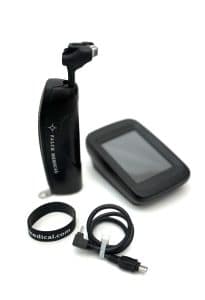
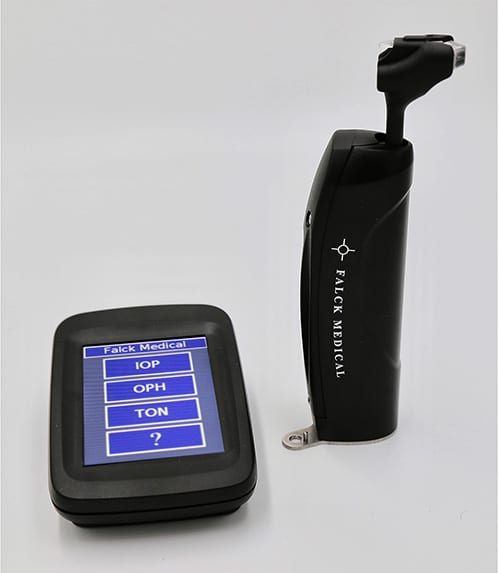
Falck Medical, INC, an FDA
registered corporation, is a leading developer of
innovative technologies with applications in the diagnosis
and treatment of ischemic retinopathies, age related
retinopathies and glaucoma. All of the technologies are
covered by multiple national/international patents and
patent pending applications.
To learn more about
these innovative technologies please contact us.
"Deus ex
Machina"
FAT1
Multifunction Device:
Falck Medical
Multifunction Device – FAT1TM
The New Standard
Slit Lamp Mounted, Cleared by the FDA for Tonometry, Ocular
Pulse Amplitude, Tonography, and Ophthalmodynamometry
Measurement.
1. Tonometry - IOP Measurement
-
Touch Screen
User Input
-
Applanation
Method
-
No
fluorescein, No Subjective Mire Alignment
-
60 Automated
Measurements in 3 Seconds
-
Measures
Variation of IOP with Cardiac Cycle – True IOP
-
Corneal
Resistance and Wetness Compensation
2. Ocular
Pulse Amplitude Measurement
3. Tonography
Measurement
-
Measures
Outflow of Aqueous Humor
-
Decreased Outflow in Glaucoma
-
Therapy
is Directed at Increasing Outflow to Lower IOP
-
Outflow
Measurement Useful for Glaucoma Management
4.
Ophthalmodynamometry Measurement
-
Pulsatile Force of Central Retinal Artery
-
Central
Retinal Artery Pressure Decreased in Vascular Disease
-
Estimate Ocular Perfusion Pressure, Important in Glaucoma
Management
5. Single Use
Disposable Prism
6. Electronic
Data Storage
-
USB
Flash Drive
-
Numeric
File
-
Excel
Format
7. Data
Display
Raise Your
Standard of Care, Eliminate Infection Risk, Enhance Your
Practice
FAT1 Technology Overview
https://www.youtube.com/watch?v=n0jWmC9Fky4&feature=youtu.be
FAT1 Device User Manual
fat1-user-guide.pdf
Falck Medical FAT1 Instructional Video
https://www.youtube.com/watch?v=B_bd8yWkMB0&feature=youtu.be
Pearls for Using the FMAT1 Device
from Falck Medical Inc
https://www.youtube.com/watch?v=UFqVhEBs1Ow
Proper Insertion of Fixed-Use Prism for Falck Medical FAT1
Device
https://www.youtube.com/watch?v=NQZnYK6BJSk&feature=youtu.be
Introduction to the Falck
Medical, Inc FMAT1 Multifunction Device.
https://www.youtube.com/watch?v=8bH3PwI15jg&feature=youtu.be
Falck Medical, Inc., FMAT1 Serial
Tonometry Measurement.
https://www.youtube.com/watch?v=GgM6GlEJOxU&feature=youtu.be
Falck Medical, Inc., FMAT1
Tonography Measurement.
https://www.youtube.com/watch?v=VNhWci4RrYY&feature=youtu.be
Falck Medical, Inc., FMAT1
Ophthalmodynamometry Measurement.
https://www.youtube.com/watch?v=R3ZlwK2x73w&feature=youtu.be
Falck Medical, Inc., FMAT1 Coding
and Reimbursement
https://www.youtube.com/watch?v=3yk25a7BQeo&feature=youtu.be
Falck Medical Multi-Function DEVICE Powerpoint
Press Conference for the Falck Medical Inc. FMAT1 Device at the
Boston AAO 2021 Meeting
Clinical and
Laboratory Trials Summary:
Tonometry
Study Summary:
In a clinical trial comparing of the Falck Medical Multifunction
Device (FAT1) in 205 eyes
the following results were obtained:
Manometric
Study Summary:
In a comparative study of the FAT1 readings to a reference
u-tube mercury manometer using human eye bank eyes, the
following results were obtained:
Clinical
Tonography Trial Summary:
In a clinical trial comparing the FAT1 to a reference
indentation tonographer for the measurement of conventional
outflow facility in 91 eyes from 91 subjects the following
results were obtained:
-
The mean
conventional outflow facility (C) difference between the
FAT1 and the reference Indentation Tonographer over a range
of 0.01 to 0.70 ul/min/mmHg was 0.0043 ul/min/mmHg ( 95% CI,
0.001 to 0.0076 ), n= 182.
-
Average FAT1
conventional outflow facility measurement in the glaucoma
group was 0.09 +/- 0.05 and in the non-glaucoma group was
0.31 +/- 0.12 ul/min/mmHg, p < 0.0001, n = 182.
-
Average FAT1
IOP measurement in the glaucoma group was 20.02 +/- 5.5 and
in the non-glaucoma group was 18.6 +/- 2.4, p = 0.01, n =
182.
-
In the High
outflow facility group (C > 0.18) (non-glaucoma, 28/30 eyes)
93.3% of the paired differences were within +/- 1.96
standard deviations of the mean difference between the FAT1
and the reference Indentation Tonographer, n=60.
-
In the Medium
outflow facility group (C >0.09 < 0.18) (glaucoma, 29/31
eyes) 95.2% of the paired differences were within +/- 1.96
standard deviations of the mean difference, n=62.
-
In the Low
outflow facility group (C < 0.09) (glaucoma, 30/30 eyes)
96.7% of the paired differences were within +/- 1.96
standard deviations of the mean difference, n=60.
Tonographic
Laboratory Study Summary:
In a comparative tonographic laboratory study using freshly
enucleated preserved eye bank eyes, the following results were
obtained:
-
For every 10
mmHg change in IOP average anterior chamber fluid volume
change was 3.22 ul/minute, for a 20 mmHg change in IOP
average anterior fluid volume change was 7.027 ul/minute and
for 30 mmHg change in IOP average anterior fluid volume
change was 11.75 ul/minute, r2 = 0.99.
-
The
correlation coefficient for volume decrease and corneal
indentation was 0.999.
-
The
correlation coefficient for volume decrease and applanation
diameter was 0.997.
Clinical
Ophthalmodynamometry (OPH) Study Summary:
In a clinical trial involving 42 adult eyes where ipsi-lateral
OPH force, brachial artery blood pressure and IOP were recorded,
the following results were obtained:
-
The average
OPH estimated Central Retinal Artery Force was 59.73 +/-
11.10 mmHg.
-
The Mean
Brachial Artery Blood Pressure (MBAP) was 93.16 +/- 8.32
mmHg.
-
The average
IOP was 15.72 +/- 3.04 mmHg.
-
The average
calculated Ocular Perfusion Pressure was 44.01 mmHg.
*Results on file with the Food and Drug Administration
News:
New Multifunction Applanation Device Which Can Be Used
as a Risk Assessment Tool in the Management of Glaucoma and
Vascular Disorders Published in CFOCEO Magazine on
03/21/2016. Click on this link to read full text of the
interview.
The FAT1 device
was cleared by the Food and Drug Administration on
01/15/2016 for market introduction with the following
indications for use: Tonometry, Ocular Pulse Amplitude,
Tonography and Ophthalmodynamometry
Case Studies:
Branch
Vein Occlusion
An
82 year old male presented with a history of Branch Retinal Vein
Occlusion in the supero-temporal quadrant of his left eye. On
examination arteriolar narrowing and arterio-venous compression
was noted. The OCT image demonstrates thinning and loss of
normal architecture in the supero-temporal quadrant. Mean
Central Retinal Artery Pressure (MCRAP) and
Ocular Perfusion Pressure (OPP) were measured using
the Ophthalmodynamometry Function of the FAT1
Device.
With normal vascular physiology and normal vessels, in the
upright position MCRAP should be equal to or greater than
60 % of ipsi-lateral Mean Arterial Brachial Blood Pressure (MABBP).
Ocular Perfusion Pressure (OPP) is the difference
between MCRAP and IOP. Ocular Perfusion Pressure
is the net force that drives blood flow into the eye (Adlers
Physiology of the Eye, Clinical Application, Tenth Edition,
Chapter 33, Ocular Circulation, page 764-765).
The measured ipsi-lateral MABBP was 106 mmHg, 60% of this value
is 60.6 mmHg. The FAT1 measured MCRAP was 52.8 mmHg which is
less than expected and the OPP was 36.2 mmHg which is also less
than expected. See FAT1 Ophthalmodynamometry Result Screen. In
the FAT1 Ophthalmodynamometry study, in healthy eyes the Average
Ocular Perfusion Pressure was 44.01 mmHg. Both values are
less than expected, documenting decreased retinal perfusion from
the BRVO and atherosclerosis.
Click to Enlarge and to Close
 |
Click to Enlarge and to Close
 |
Amaurosis Fugax , Carotid
Atherosclerosis
An 80 year old male presented with an episode of temporary
vision loss in his right eye one week ago. No plaque or other
emboli were found on examination. Using the
Ophthalmodynamometry Function of the FAT1 Device, Mean Central
Retinal Artery Pressure (MCRAP) and Ocular Perfusion Pressure (OPP)
were measured.
Measured Mean Ipsilateral Arterial Brachial Blood
Pressure (MABBP) was 89.3 mmHg. Sixty percent of this value is
53.6 mmHg. Measured Mean Central Retinal Artery Pressure (MCRAP)
was less than expected at 44.9 mmHg. Ocular Perfusion Pressure (OPP)
was also less than expected at 32.1 mmHg.
See the FAT1
Ophthalmodynamometry Result Screen.
Because the history and the FAT1 results were suggestive of
carotid vascular disease, an intracranial Magnetic Resonance
Imaging Arteriogram was performed which confirmed
atherosclerotic carotid vascular disease and raised the
possibility of an anterior communicating artery aneurysm. See
the MRA report. A CTA was scheduled for further evaluation.
The CTA confirmed an anterior communicating artery aneurysm.
Click to Enlarge and to Close
 |
Click to Enlarge and to Close
 |
Pigmentary Glaucoma
An 57 year old male with Pigmentary Glaucoma in
the right eye presented with elevated Intraocular Pressure (IOP).
Current medications were Combigan BID, Pilocarpine 1% TID,
Travatan QHS and Diamox 500 mg BID. On gonioscopy the angle was
open with 4+ pigment. Laser Trabeculoplasty was performed. The
IOP remained elevated at 30 mmHg well above the target value.
Heidelberg Retinal Tomography documented progressive thinning of
the nerve fiber layer at 6 and 12 o’clock. See the HRT results.
The Tonography Function of the FAT1 Device was used to
assess Trabecular Meshwork Aqueous Humor Outflow.
Aqueous Humor Outflow was reduced at 0.109 microliters /
minute and the ratio of the IOP (Po) to Outflow (C), Po / C
Ratio, was 204.6. See FAT1 Tonography Results Screen.
Click to Enlarge and to Close
 |
Click to Enlarge and to Close
 |
In the FAT1 Tonography Clinical Study, Glaucomatous eyes had an
Outflow Value less than 0.18 microliters / minute. A Po / C
ratio greater than 100 is characteristic of glaucomatous eyes
(Chandler and Grants Glaucoma, Fourth Edition, Chapter 6,
Tonometry and Tonography, page 45 - 48).
Visual field testing was performed. The decreased outflow
facility, which did not respond to medical or laser surgery, was
the cause of the elevated IOP. The patient underwent a
trabeculectomy to bypass the dysfunctional trabecular meshwork.
The Tonography function of the FAT1 device was
used to assess aqueous humor outflow after the trabeculectomy
procedure. Outflow was increased to 0.745 microliters / minute,
confirming the effectiveness of the trabeculectomy.
See the post-trabeculectomy procedure FAT1 Tonography Results
Screen.

Angle Closure
/ Pupillary Block
A 67
year old male presented with an intumescent count fingers
cataract in the right eye. Pupillary block was present. On
direct gonioscopic examination the anterior chamber angle
was closed at Grade 1. In the left eye and the anterior
chamber angle was open at Grade 4.
The Tonography function of the FAT1 device was used to
assess aqueous humor outflow through the trabecular
meshwork. It was reduced to 0.044 microliters / minute and
the Po / C ratio was increased at 327.3. See the FAT1 Tonography Results Screen for the Right Eye.

In the left eye, the aqueous humor outflow was 0.203
microliters / minute and the Po / C ratio was 88.7. See the
FAT1 Tonography Results Screen for the left eye.

One percent Pilocarpine was placed in the right eye and a
YAG Laser Peripheral Iridectomy was performed. The pupillary
block decreased and the anterior chamber angle deepened to
Grade 3.
Aqueous humor outflow was assessed post-iridectomy using the
Tonography Function of the FAT1 Device. It increased to
0.374 microliters / minute, confirming the effectiveness of
the iridectomy. See the post-iridectomy FAT1 Tonography
Results Screen.

Publications
Bonus Feature Modern Optometry October 2021. A New Glaucoma
Management Tool Measures What Eye Care Providers Strive to
Improve. Click On Title Too Read Full Text.
Association for Research
and Vision in Ophthalmology April 2nd, 2010.
Abstract Title:
The Effect of Intraocular anti-VEGF Injections on Ocular
Perfusion Pressure.
Authors:
Elias Reichel, Heeral Shah, Tufts University New
England Eye Center
Keywords:
Age Related Macular Degeneration, anti-VEGF, Ocular Perfusion
Pressure, Intraocular Pressure.
Purpose:
Blood flow into the eye is determined by the ocular perfusion
pressure (OPP). OPP is the difference between the mean central
artery pressure (MCRAP) and the intraocular pressure (IOP),(OPP
= MCRAP – IOP).1 Intraocular anti-VEGF injections can
raise intraocular pressure and decrease retinal blood flow.2
The aim of this study was to investigate the effect that
intraocular anti-VEGF injections have on ocular perfusion
pressure.
Methods:
The OPP, MCRAP, IOP and Ocular Pulse
Amplitude (OPA) was measured using the Falck Medical
Multifunction Applanation Tonometer (FAT1) in twenty eyes of
twenty patients immediately pre and post anti-VEGF injection.
The mean upright ipsilateral brachial blood pressure (MBBP) was
also recorded. The independent-samples t-test was used to
analyze the pre and post injection differences. Twelve eyes
received Avastin and eight eyes Lucentis. All eyes received
0.5mg.
Results:
The cohort mean age and MBBP was 75.1+/- 19 years and 93.45
+/-11 mmHg. The mean decrease in MCRAP post-injection was 10.3
mmHg, p = 0.03 (45–34.7). The mean increase in IOP
post-injection was 10.8 mmHg, p = 0.0002 (28.5–17.7). The mean
decrease in OPP post-injection was 11.9 mmHg, p = 0.003
(27.3-15.4). The mean decrease in OPA post-injection was 0.5
mmHg, p = 0.03 (2.3-1.8). In twelve eyes the post-injection OPP
decreased due to both an increase in IOP and a decrease in MCRAP.
In two eyes the post injection OPP decreased to zero from both
an increase in IOP and a decrease in MCRAP.
1
Kaufman PL, Alm A. Adlers Physiology of the Eye. Tenth Edition
2003;764-67.
2
Papadopoulou DN, Medrinos E, Mangioris G, et al.
Intravitreal ranibizumab may induce retinal arteriolar
vasoconstriction in patients with neovascular age-related
macular degeneration. Ophthalmology.2009;116:1755-61.
c
Clinical and Manometric Comparison of The Falck Autotonometer
and The Goldmann Tonometer.
Association for Research in Vision and
Ophthalmology, April 27th, 2008.
F. Y. Falck, R. Falck.; University of Connecticut
School of Medicine, Farmington, CT.
Purpose:
In
recent clinical studies the Goldmann tonometer has been found to
lack accuracy where the corneal thickness varies from the
calibration standard of 0.5 mm (1). If the corneal thickness is
less then 0.5 mm the intraocular pressure will be underestimated
possibly leading to a false negative diagnostic impression and
if the corneal thickness is greater then 0.5 mm the intraocular
pressure will be overestimated possibly leading to a false
positive diagnostic interpretation. The greater the deviation of
thickness from the mean the greater the over or underestimation
of intraocular pressure (2). Corneal curvature may also effect
the accuracy of the Goldmann. The smaller the corneal radius the
greater the resistance to flattening. Thus, steeper corneas may
lead to an overestimation of intraocular pressure with the
Goldmann and flatter corneas may lead to an underestimation (3).
Additionally, there are also
concerns about transmission of infectious agents with reusable
applanation tonometry prisms or tips (4).
The Autotonometer is an
automated electro-optical microprocessor driven tonometer that
performs multiple applanations in an average measurement time of
0.5 seconds. The eye pressure is digitally displayed and
retained in memory for recall. The device compensates for
corneal thickness and curvature and can be used portably or on
the slit-lamp microscope. A small plastic disposable applanation
prism prevents spread of infection. Fluorescein is not required.
This study was undertaken to
determine the accuracy of the Autotonometer manometrically and
clinically as compared to the Goldmannn tonometer.
Methods: Eye
bank eyes were pressurized using saline to a known value in a
range of 5 to 60 mmHg with a digital manometer (Bio-Tek
Instruments, INC., Winooski, VT.). Calibration of the digital
manometer was verified with a u-tube mercury manometer. The
Autotonometer applanation force was then recorded at 5 mmHg
intervals from 5 to 45 mmHg. Multiple readings at each point
were obtained.
In the clinical
comparison trials 95 eyes were enrolled. The intraocular
pressure was measured in an alternating sequence of the Goldmann
followed by recording the Autotonometer applanation force and
then in reverse for the next study eye.
Linear
regression analysis was performed.
Results: In
the manometric eye bank studies a perfect correlation (r = 0.99,
y = - 0.51 + 0.3 x) was found with the Autotonometer over an
intraocular pressure range of 5 to 45 mmHg (Figure 1). In the
comparison clinical trials the correlation between the
Autotonometer
and the Goldmann tonometer was 0.88 (y = - 6.79 + 0.73 x) over a
range of 8 to 62 mmHg (Figure 2).
Figure 1:
Autotonometer Manometric Eye Bank Experiment
Figure 2:
Clinical Comparison of Autotonometer and The Goldmann Tonometer
Conclusions:
The Autotonometer produced accurate and repeatable applanation
force measurements that correlated in a perfect linear
relationship with manometric intraocular pressure. Additionally,
a strong correlation was found with Goldmann estimates of eye
pressure. Some of the variability found between the Goldmann and
the Autotonometer is most likely related to the subjective
measurement error associated with the Goldmann. The
Autotonometer is objective and requires minimal operator skill.
Other probable sources of variability would be variations in
corneal thickness and curvature in the clinical study eyes. The
Autotonometer compensates for the effect of corneal thickness
and curvature while the Goldmann tonometer does not. Additional
clinical and laboratory studies are ongoing.
References:
1.
Goldmann H, Schmidt T. Uber
Applanationstonometrie.
Ophthalmologie
1957;134:221-42.
2.
Shah S, Chatterjee A, Mathai M, et
al. Relationship between Corneal Thickness and Measured
Intraocular Pressure in a General Ophthalmology Clinic.
Ophthalmology 1999;106:2154-2160.
3.
Woo S, Kobayashi A, Lawrence C, et
al. Mathematical Model of the
Corneo-Scleral Shell As Applied to
Intraocular Pressure-Volume Relations and Applanation Tonometry.
Ann Biomed Eng 1972;1:87-98.
4.
CDC. Recommendations for Preventing
Possible Transmission of Human T-Lymphotrophic Virus Type 3/Lymphadenopathy-
Associated Virus from Tears. MMWR 1985;34:533-534.
CR:P
Agency for Healthcare Research
and Quality: Comparative Effectiveness of Screening for
Glaucoma. January 10, 2011.
Clinical Comparison of FAT1 and
Goldmann Applanation Tonometer.
Introduction:
The Falck Medical Multifunction
Device (FAT1) measures intraocular pressure (IOP) using the same
method of applanation (Imbert-Fick Law) as the Goldmann
Applanation Tonometer (GAT). The GAT IOP measurement does not
correct for the variation in corneal biomechanics or for the
variation of IOP with the cardiac cycle. The pulsating mires of
the GAT are evidence of the increase in IOP during systole.1
The FAT1 measurement corrects for the variation in
corneal biomechanics and measures the variation of IOP with the
cardiac cycle.
The GAT takes only one subjective
user dependent measurement. So, it is not possible to know the
accuracy and precision of the measurement.1 The FAT1
captures a measurement every 7 milliseconds over multiple
cardiac cycles. The measurement is objective, no mire alignment
and user independent. Measurement data captured by the FAT1 is
statistically analyzed for precision and accuracy. The Mean IOP,
% Variation, the IOP Variation with the Cardiac Cycle (OPA) and
the Number of IOP Measurements Captured (N) are displayed. The
data is saved to a secure electronic file.2
The GAT prism
cannot be sterilized and therefore there is a risk of
transmission of infectious disease agents that are present in
the tears.1 The FAT1 has a fixed used disposable
prism that blocks infectious disease transmission.2
The FAT1 Device
also measures Conventional Outflow Facility (Tonography).2
Impaired outflow is the primary cause of glaucoma.3
The FAT1 also
measures Mean Central Retinal Artery Pressure (MCRAP) (Ophthalmodynamometry).2
MCRAP and IOP is used to calculate Ocular Perfusion Pressure (OPP)
(OPP = MCRAP – IOP). OPP is the net force that drives blood flow
into the eye.4
The purpose of the FDA Clinical
Study was to evaluate the precision and accuracy of the FAT1 IOP
measurement as compared to the GAT.
Methods:
The FAT1 device clinical study was a
single site investigator study with external auditing oversight
by the United States Food and Drug Administration (FDA) and an
Independent Contract Review Organization (CRO). Data analysis
was provided by the CRO and the FDA. One hundred twenty-five
subjects and 209 eyes were coded by numeric ID and entered into
a secure electronic data base for final analysis. The FAT1 was
connected directly to the electronic data base. Measurement data
from the FAT1 electronically went directly into each subject
file. Data from the GAT, pachymetry and keratometry measurements
were manually entered. Sixty-one eyes underwent pachymetry and
keratometry measurements.
The measurement sequence was
randomized with the first ten eyes measured by the FAT1 first
and the next ten eyes measured by the GAT first. This
randomization sequence was maintained throughout the study. Two
FAT1 devices (FAT1A and FAT1B) were used in the study. All study
data went directly into an electronic study file. Once entered
the data was secure and could not be changed.
The FAT1 device automatically
calibrates before any measurement. The GAT was manually
calibrated before each measurement.
The study subject age range was 24
to 94 years. One-third of study eyes were either ocular
hypertensive or had glaucoma. The study was carried out in
accordance with the FDA Guidance for Tonometers, as published
March 27th, 2006.
Subjects were screened for
established inclusion and exclusion criteria. If found eligible,
each study subject signed an informed consent document prior to
participation. The study was designed as a one-time exposure to
the FAT1 and GAT. All measurements were taken by two ophthalmic
technicians who were trained in the use of the FAT1 and the GAT.
The clinical study was conducted in accordance with the
abbreviated rules for investigational device exemptions within
the meaning of 21 CFR Part 812.2(b) and for the rights and
protections of investigational subjects in accordance with 21
CFR Part 50 – Informed Consent; and 21 CFR Part 56 –
Institutional Review Board Regulations. Full approval to conduct
the study was awarded on November 1, 2006.
Study Subject Characteristics:
One hundred twenty-five subjects
(209 eyes) were enrolled. Overall accountability at the end of
the study was 100%. There were no withdrawals. One hundred
forty-eight eyes were considered normal, and 61 eyes were
considered ocular hypertensive or glaucomatous. In normal
subjects the range of IOP was 9 to 21 mmHg. In glaucoma subjects
the range of IOP was 10 to 56 mmHg. The overall age range was 24
to 94 years. There were 71 males and 54 males enrolled in the
study.
Adverse Events:
No adverse events were reported
during the course of the clinical study.
Safety:
The results of all study subjects
were considered for the safety evaluation. No complications were
reported during the clinical study.
Incident Report:
During the clinical study, one
subject was found to have a large disparity of Mean Central
Retinal Artery Pressure (MCRAP) between the two eyes. MCRAP was
reduced in the left eye. The disparity led the principal
investigator to refer the subject for emergency admission to the
local medical facility. Diagnostic imaging confirmed the
presence of an internal carotid artery aneurysm on the left
side. The subject was treated and is doing well. This is not
considered an adverse event. Enrollment in the study likely
saved the subjects life. The subject was excluded from the data
analysis.
Results:
See Scatter Plot
Figure 1A.
The FAT1 measured IOP value is plotted on the x-axis and the GAT
IOP on the y-axis. The regression line, the equation and the
r-squared value is displayed. The maximum r-squared value is 1.
The higher the number, the greater the strength of the
relationship. The r-squared value is 0.925.
See Bland –
Altmann Plot Figure 2A.
The paired
difference between the reference GAT and the FAT1 is plotted on
the y-axis and the mean of the GAT and FAT1 is plotted on the
x-axis. The mean and + / - 1.96 standard deviation is displayed.
The average mean difference is 0.7 mmHg.
See Table 1 – Number and Percent of
Paired Differences That Exceed Tolerance by each Pressure range
A tabulation of the number of eyes
and percent of paired differences (GAT – FAT) that exceeds the
tolerance limit of 5 mmHg for each pressure range as described
in ANSI Z80.10 – 2003 is provided. In this comparison zero % of
the paired differences exceeded the tolerance limit for an IOP
range of 7 to 16 mmHg, 2.9 % for an IOP range of >16 to 23 mm
Hg, and 5.41% for an IOP greater than 23 mmHg.
In the IOP range > than 23 mmHg,
eight of these eyes had a corneal thickness of 595 to 625
microns. The GAT reading in these eyes was on average 7.4 + / -
1.2 mm Hg higher than the FAT1 reading. It is well established
in the literature that the GAT will overestimate the IOP when
the corneal thickness is greater than 500 microns.5
Correcting the
GAT reading using a published nomogram of delta IOP = (-0.0423 x
CCT) + 23.38 decreased the number of eyes above the tolerance
limit in the > 23 mmHg group of eyes.
See Figure 3 and
4. Regression of FAT1 Readings and Corneal Thickness and
Curvature.
The FAT1 readings are plotted on the y-axis and
corneal thickness and curvature are plotted on the x-axis. The
r-squared value for FAT1 versus Corneal Thickness is 0.06. The
r-squared value for Corneal Curvature is 0.04. The low
correlation coefficients confirm that the FAT1 readings are
independent of corneal thickness and curvature.
See Distribution
and Randomness Test, T-Test and Wilcoxon Rank Sum Test. Study
Bias Evaluation.
The output from
the FAT1 device is independent of the user. During the study the
data went directly into an electronic secure file. GAT data was
manually put into each file. The testing sequence was
randomized. The first ten eyes were tested with the FAT1 first.
The next ten eyes with the GAT first. If the FAT1 was first, the
FAT1 data went into the file first. If the GAT was first the
data was entered into the file first and the FAT1 data
electronically went into the file second. Once the data is in
the file it cannot be changed. One hundred seven eyes were
tested with the FAT1 first and 98 eyes were tested with the GAT
first. There was no statistically significant difference between
the measurement results and the testing sequence. No user, study
or measurement bias was found.
Conclusion:
The accuracy,
precision, repeatability and safety of the FAT1 device is
confirmed. The FAT1 device measurements are user
independent and independent of corneal biomechanics. The FAT1
device measures the variation of IOP with the cardiac cycle and
incorporates this data into the displayed IOP. All data is
statistically analyzed for precision and accuracy. Data capture
is rapid at 0.7 milliseconds. The fixed use disposable prism is
an absolute barrier to infectious disease transmission which is
a risk with existing tonometer technology.
References:
1.
Goldmann H, Schmidt T. Uber
Applanationstonometric Ophthalmologic. 1957;134:221-242.
2.
FDA510k141591
3.
Chandler and Grant’s Glaucoma. David
Epstein, Rand Allingham, Joel Schuman. Fourth Edition. 1997.
Practical Aqueous Humor Dynamics, pp19-20. Tonometry and
Tonography, pp 43-44.
4.
Adler’s Physiology of the Eye.
Clinical Application. Paul Kaufman, Albert Alm. Tenth Edition.
2003. Circulation, pp 764-767.
5.
Ehlers N, et al. Applanation
Tonometry and Central Corneal Thickness. ACTA Ophthalmologica.
Vol 53. 1953.
6.
Kohlhaas M, et al. Arch Ophthal.
Vol 24. April 2006.
Agency
for Healthcare Research and Quality. Comparative
Effectiveness of Screening for Glaucoma. January 10, 2011.
Clinical Comparison of FAT1 to
Calibrated Weight Indentation Tonography.
Introduction:
The Falck Medical, Inc. FAT1 device
measures intraocular pressure (IOP), ocular pulsatile amplitude
(OPA), the force required for pulsation of the central retinal
artery (ophthalmodynamometry-OPH) and aqueous outflow (tonography
- TON). The device was cleared for these Indications of Use
under FDA510k151491. The primary cause of glaucoma is impaired
outflow of aqueous humor 1. All current standard of
care pharmacological and surgical treatments of glaucoma are
designed to increase aqueous humor outflow. Thus, it is
important to be able to measure outflow facility to determine
therapeutic efficacy. Measuring IOP is not an accurate
assessment of therapeutic response2. Aqueous humor
production and IOP vary diurnally3. In glaucomatous
and normal eyes, there is no scientific evidence that aqueous
humor outflow (Tonography) varies diurnally1,2.
The FAT1 device uses the method of
tonography to measure conventional outflow facility. During
tonography, the force applied, corneal indentation and
applanation area are monitored and recorded by the
microprocessor and the optical system. Actively recording and
monitoring force application, corneal indentation and
applanation area is a significant improvement over existing
indentation tonographers. The FAT1 device also monitors central
corneal contact. The only skill required by the technician or
doctor is to initially place the
prism in central contact with the
cornea. The measurement process is initiated with central cornea
contact. The measurement is automated and independent of the
user.
Three individual IOP measurements
consisting of multiple samples obtained every 7 milliseconds are
used to calculate an average IOP measurement. For example, an
individual average IOP reading of 16 mmHg consists of
approximately 60 samples. Within each individual IOP
measurement, the samples are analyzed for repeatability and
accuracy (Step 1 analysis). If acceptable an average IOP is
calculated. In Step 2 analysis each individual average IOP
measurement is analyzed for repeatability and accuracy. The
maximum allowable variation for Step 1 and 2 analyses is 10%.
Step 1 and Step 2 analysis criteria must be met, otherwise the
FAT1 device will prompt for a repeat measurement. The same
process is used to evaluate applanation area, force application
and corneal indentation. Acceptable measurements are displayed
on the CDU with percent variation. Using this process,
measurement is user independent.
The FAT1 device uses a fixed use
disposable prism that is an absolute barrier to the transmission
of infectious disease which is an issue with other devices.
Methods:
The FDA 510k FAT1 Indentation
Tonography clinical study was a single site, single
investigator, blinded prospective Institutional Review Board
approved study. Study oversight and monitoring was provided by
an external Contract Review Organization (CRO) and the FDA.
Study data analysis was done by the FDA and an independent CRO.
The CRO statistical group was blinded to which participant was
in the glaucoma group versus the normal group. Ninety-one
subjects and ninety-one eyes were enrolled into the study. The
ninety-one subjects (eyes) were coded by a numeric ID and
entered into a secure electronic data base. All measurement
output went into this secure electronic database. All
measurements were performed by two trained ophthalmic
technicians. Two different FAT1 (FAT1A, FAT1B) devices were
used in the study for comparison to the Model 30. Before each
measurement the FAT1 device performs a calibration routine. All
FAT1 devices calibrate to the same internal standards. The Model
30 was calibrated before each use according to the user
instruction manual. None of the devices used in the study failed
calibration at any time.
Two groups of eyes were enrolled for
the study. In Group A, sixty-one eyes with a diagnosis of
glaucoma (open angle or closed angle) or ocular hypertension
were enrolled. The criteria for the diagnosis of glaucoma was
glaucomatous nerve fiber layer defects documented by
computerized tomography (Heidelberg Retinal Tomograph, HRT2),
glaucomatous visual field defects documented by computerized
visual field testing (Zeiss Humphrey 30-2 Program) and a history
of elevated IOP (>24 mmHg). Additionally, for the diagnosis of
closed angle glaucoma, on direct gonioscopy the drainage angle
was closed. For the diagnosis of ocular hypertension, the eye
enrolled had an IOP greater than 24 mmHg without any
glaucomatous findings. Thirty eyes had open angle glaucoma,
eight eyes had angle closure glaucoma and twenty-three eyes had
ocular hypertension.
The average age of Group A subjects
was 65.7 +/- 13.0 years and the average age of Group B subjects
was 64.3 +/- 8.7 years which was not statistically significantly
different, p = 0.60. In Group A there were 38 females and 23
males. In Group B there were 24 females and 6 males.
The measurement sequence FAT1 versus
Model 30 changed every five eyes. Intra-visit FAT1 variability,
inter-visit FAT1 variability and FAT1A and FAT1B intra-visit
variability analysis was performed. Operator effect was also
analyzed. External independent statistical analysis was provided
by Synectechs, Inc., who was blinded as to which was the normal
group and which was the glaucoma group. All eyes were used in
the analysis. There were no screen failures, no loss to
follow-up and no adverse events.
The clinical study was conducted in
accordance with the abbreviated rules for investigational device
exemptions within the meaning of 21 CFR Part 812.2(b), with the
rights and protections of investigational subjects in accordance
with 21 CFR Part 50-Informed Consent and 21 CFR Part
56-Instituitional Review Board
Regulations. Instituitional Review
Board approval was granted on February 16th, 2010.
For further protocol details see Section 14.4.
Results:
In Group A, on computerized visual
field testing the average pattern standard
deviation defect was 3.67 +/- 4.1
db, range 1.1 to 20 db and the average mean defect was – 3.0 +/-
3.6 db, range –15.4 to 1.2 db. The average IOP (Po) was
20.02 +/- 5.5 mmHg with a range of
12.9 to 42 mmHg. The average outflow facility (C) was 0.09 +/-
0.05 ul/minute with a range of 0.01 to 0.22 ul/minute.
In Group B the documented IOP was
consistently less than or equal to 24 mmHg and none of the
thirty eyes enrolled had no examination findings consistent with
the diagnosis of glaucoma. Additionally, none of the subjects
had any known glaucoma risk factors. Thirty eyes were enrolled
in Group B. The average IOP (Po)
was 18.7 +/- 2.4 mmHg with a range
of 14.6 to 24 mmHg. The average outflow facility (C) was 0.31
+/- 0.12 ul/minute with a range of 0.16 to 0.6 ul/minute.
Two repeat measurements on each of
the ninety-one subject eyes were taken with the FAT1 device for
a total of 182 outflow facility measurements. Sixty measurements
were in the low outflow range of 0.01 to 0.095, sixty-one in the
middle range of 0.10 to 0.17 and
sixty-one in the high range of 0.18 to 0.6 ul/minute.
The difference in IOP and outflow
facility between Group A and Group B was statistically
significant, 20.02 +/- 5.5 vs. 18.7 +/- 2.4 mmHg, p=0.0221 and
0.09 +/ - 0.05 vs. 0.31 +/- 0.12 ul/minute, p < 0.0001.
Intra-visit Variability Analysis:
Two separate repeat IOP (Po) and
outflow facility (C) measurements were obtained with the FAT1
device during the same visit. There was no statistically
significant difference between the first measurement versus the
second measurement for IOP and outflow facility, 18.65 +/- 2.46
vs. 18.62 +/- 2.40 mmHg, p = 0.95; 0.31 +/- 0.12 vs. 0.31 +/-
0.12 ul/minute, p=0.99, n=60.
Inter-visit Variability Analysis:
At the initial visit and at the
follow-up visit within six weeks, the IOP (Po) and
outflow facility (C) was measured
with the FAT1 device. The operator was blinded to the first
visit results. There was no statistically significant
difference between the first visit measurement versus the second
visit measurement of IOP and outflow facility, 18.66 +/- 2.40
vs. 18.60 +/- 2.46 mmHg, p=0.90;0.31 +/- 0.12 vs. 0.30 +/- 0.12
ul/min, p=0.64, n=60.
Testing Sequence Analysis, FAT1 and
Model 30:
The testing sequence, FAT1 versus
the Model 30 changed every five eyes. Distribution and
randomness testing of the IOP (Po) and outflow facility(C)
measurement difference between the FAT1 and the Model 30 and the
testing sequence was carried out using the Wilcoxon test. The
mean difference between the FAT1 and the Model 30 and the
testing sequence for IOP was 0.0009 mm Hg and for outflow
facility was 0.0007 ul/min-mmHg. The difference between the IOP
and outflow facility measurement obtained with the FAT1 device
versus the Model 30 and the testing sequence was not
statistically significantly different, p = 0.61 and 0.86 for the
Wilcoxon two-sided test (n=182).
Mean Measurement Difference between
the Two Devices:
The mean measurement difference
between the Model 30-IT and the FAT1 for IOP (Po) was -0.21 mmHg
and for outflow facility (C) was -0.006 ul/minute for Group A
(n=122), and 0.005 mmHg and -0.001 ul/minute for Group B
(n=60).
Ninety-three %
and 96% of the Group A paired differences for IOP and outflow
facility respectively, are within +/- 1.96 standard deviations
of the mean difference. For Group B, 97% and 93% of the paired
differences for IOP and outflow facility respectively, are
within +/- 1.96 standard deviations of the mean difference.
Please see the Bland –Altman data plots (Figures 2a) in Section
14.3.
Mean Measurement Difference between
Group A and Group B:
The mean measurement difference for
IOP (Po) and outflow facility (C) was compared for Group A
versus Group B using the FAT1 and Model 30. For the FAT1
device, the measurement difference for IOP (Po) and outflow
facility (C) was statistically significantly different between
Group A and Group B. Group A IOP was 20.02 +/- 5.5 mmHg and
Group B IOP was 18.6 +/- 2.4 mmHg, p =0.0221 (unequal variance).
Group A IOP range was 12.9 to 42 mmHg. Group B IOP range was
14.6 to 24 mmHg. Group A outflow facility was 0.09 +/-0.05 ul/minute
and Group B outflow facility was 0.31 +/- 0.12 ul/minute, p <
0.0001. Group A outflow facility range was 0.01 to 0.22 ul/minute.
Group B outflow facility range was 0.16 to 0.6 ul/minute.
For the Model 30 device, the
measurement difference for IOP (Po) and outflow facility (C) was
statistically significantly different between Group A and Group
B. Group A IOP was 19.8 +/- 5.7 mmHg and Group B IOP was 18.7
+/- 1.9, p = 0.047 (unequal variance). Group A IOP range was 14
to 46 mmHg. Group B IOP range was 15 to 22 mmHg. Group A
outflow facility was 0.08 +/- 0.04 ul/minute and Group B outflow
facility was 0.31 +/- 0.12 ul/minute, p < 0.0001. Group A
outflow facility range was 0 to 0.21 ul/minute. Group B outflow
facility range was 0.16 to 0.6 ul/minute.
Correlation:
The correlation between IOP (Po) and
outflow facility (C) measurements obtained with the FAT1 versus
the Model 30 was studied using linear regression analysis. For
Group A the linear correlation coefficient was 0.88 for IOP and
0.77 for outflow facility. The null hypothesis that the slope
was zero is rejected, p < 0.0001. For Group B the linear
correlation coefficient was 0.69 for IOP and 0.97 for outflow
facility. The null hypothesis that the slope is zero is
rejected, p< 0.0001. See Figures 1a in Section 14.3.
Precision Analysis:
1. Operator plus the Device
The effect of different operators
(operator 1 vs. 2) with the same FAT1 device
with the same eye was evaluated for
IOP (Po) and outflow facility (C) using
ANOVA. No significant operator
effect was found for IOP (p= 1.0) or outflow facility (p= 0.99).
2. Same Operator with Different
Devices
The effect of different devices,
FAT1A versus FAT1B, with the same operator and the same eye was
examined for the measurement of IOP (Po) and outflow facility
(C) using ANOVA. No significant device effect was found for IOP
(p=0.96) or outflow facility (p=0.94).
3. Replicate Analysis, Same
Operator, Same Device
The repeat measurement difference
for IOP (Po) and outflow facility (C) with the same operator,
same FAT1 device and same eye was examined using ANOVA. No
significant repeat measurement difference was found for IOP
(p=0.95) or outflow facility (p=0.99).
Conclusion:
The clinical study results
demonstrate the safety, precision, accuracy and repeatability of
the FAT1 device. The ability of the FAT1 device to discriminate
between glaucomatous and non-glaucomatous eyes is also
demonstrated. The clinical study confirms the relationship
between the severity of glaucoma and impaired outflow facility.
Eyes with advanced glaucoma had Outflow Values of less than
0.09 ul/mmHg and eyes with moderate glaucoma had outflow values
of 0.10 to 0.17 ul/mmHg.
References:
1.
Becker-Shaffers Diagnosis and
Therapy of the Glaucomas. H. Dunbar Hoskins, Michael Kass. Sixth
Edition. 1989. Aqueous Humor Dynamics, pp 52-53.
2.
Chandler and Grant’s Glaucoma. David
L. Epstein, Rand Allingham, Joel S. Schuman. Fourth Edition.
1997. Aqueous Humor Dynamics, pp19. Tonometry and Tonography ,
pp 43-44.
3.
Adler’s Physiology of the Eye.
Clinical Application. Paul Kaufman, Albert Alm. Tenth Edition.
2003. Aqueous Humor Hydrodynamics, pp 237-289.
Issues
with Current Tonometer Technology, Review of Published Peer
Reviewed Literature
The Goldmann
Applanation Tonometer is based upon a proven physical principle,
the Imbert-Fick Law. Use of this law to measure intraocular
pressure has major drawbacks, which were identified by Professor
Goldmann in his original publication: “On Applanation Tonometery
by H. Goldmann and T. Schmidt, published in Ophthalmologica 134,
221-242, 1957”.
The original
publication was translated from German into English with the
assistance of Pamila Seiving, Former Head Librarian, University
of Michigan Kellogg Eye Center, and Holger Hansen, M.D., Dr. P.H.,
Professor of Community Medicine, University of Connecticut
School of Medicine. What follows are excerpts taken from the
original text, which identify the issues and limitations
associated with Applanation Tonometry.
It is
important to recognize that non-contact tonometers are not based
on the Imbert-Fick Law and therefore are not applanation
tonometers. The question to ask is what physical law do they use
to estimate eye pressure? No known proven physical law
validating the methodogy of non-contact tonometers can be found
in the published literature. They also do not have the ability
to compensate for any of the measurement errors that Dr.
Goldmann so aptly described.
1.
Corneal Wetness, Thickness and Elasticity
“Imbert-Fick’s Law States that the pressure of a fluid sphere,
that is surrounded by a thin membrane can be measured by a
counter pressure, which flattens the membrane. His necessary
condition is that the membrane is extremely thin and without
stiffness and that no other factors are involved”, page 221.
“The 0.5 mm
thick cornea represents by no means an extremely thin membrane
without stiffness… The surface of the cornea is moistened by
fluid. Consequently, capillary forces will operate when the
cornea is flattened, depending on the moistening fluid and the
adhesive properties of the flattening device and the cornea”,
page 222.
“Thus, a
number of new problems arise which the abstraction of
Imbert-Fick’s law does not take into account”, page 222.
“Elasticity
has the (dimension) characteristics of pressure and, therefore
acts as additional pressure”, page 223.
“We have
assumed thus far that K1 (rigidity factor)
is an expression of completely elastic forces. But because the
cornea represents a rheological system, it should be presumed
that it “floats” under the influence of deforming forces, i.e.,
after prolonged impact of those forces the cornea gains a new
balance … One can see that in this experiment (Table VII and
Figure 9), the tonometrically measured pressure declines in
spite of manometrically constant pressure… This is an expression
of floating of the cornea”, page 232.
“Under
circumstances that vary much from our measurement conditions
(abnormally thin or thick cornea, e.g. keratoconus, animal eyes,
epithelial edema) errors of several millimeters are to be
expected”, page 241.
As stated by
Dr. Goldmann, The Goldmann tonometer cannot measure and
therefore cannot compensate for the forces due to corneal
wetness, thickness and elasticity. These forces affect the
accuracy of all tonometers including non-contact tonometers.
Issue:
Current tonometer technology cannot measure the forces due to
corneal wetness, thickness and elasticity. Therefore, the
current technology cannot compensate for these forces, which
limits the accuracy of the measurement.
Solution: The FMAT1 optical and force generation system measures
the forces due to corneal wetness, thickness and elasticity. The
device compensates for these forces, eliminating the measurement
errors associated with use of the Imbert-Fick Law.
2.
Intraocular Pressure Variation due to the change in Diastolic
and Systolic Blood Pressure
“One
recognizes the coincidence of the two half rings (Fig 13) but
some general technical expertise is necessary because eye
pressure varies with the pulsating blood pressure. With correct
measuring position, one can see the two half rings moving across
from each other, with the inner margins of the half rings moving
equally far to the left and the right” , page 240.
“Thus even
more since the quickly established eye pressure does not reflect
the natural average eye pressure at the time of measurement. The
natural average eye pressure at a given point could be
recognized only if one could control constant changes due to not
only the pulse wave and breathing but also the impact of the
outer eye muscles, the changing tension of the lids and
emotional influences” , page 241.
Issue:
The Goldmann tonometer does not measure the variation in
intraocular pressure (IOP) that occurs with the cardiac cycle.
IOP is higher in systole than diastole. The pulsating mires of
the Goldmann Tonometer are evidence of this. When the inner
edges of the mires are aligned, that is the diastolic phase of
the cardiac cycle. This can be confirmed by checking the radial
pulse when the inner edge of the mires are aligned, which is the
end point according to the instruction manual. The mires
separate during systole and cannot be aligned. The Goldmann
tonometer cannot and does not measure IOP during systole.
The
average individual spends one-third of the time in systole and
two-thirds in diastole. Because the Goldmann tonometer cannot
measure the systolic IOP, the measurement is not a true average
IOP. One third of the IOP data is not being measured.
Other
tonometers are not measuring the true average IOP as well. They
lack the ability to determine at what point in the cardiac cycle
data is being captured. The data capture is random. So a true
average IOP is not being measured.
The
true average IOP is the combination of the IOP during systole
and diastole.
When
blood pressure is measured both the systolic (SBP) and diastolic
(DBP) is recorded. From those two values, the mean arterial
pressure (MAP) is calculated, ((2DBP + SBP) / 3) = MAP.
Solution: The FMAT1 optical system is able to determine what
phase of the cardiac cycle the measurement is captured. The
device measures the IOP during systole and diastole for several
cardiac cycles and calculates a true average IOP. The Ocular
Pulse Amplitude (OPA) is the variation in IOP with the cardiac
cycle. The FMAT1 device measures and displays the true average
IOP and the OPA.
3.
Repeatability, Precision and Accuracy
Repeatability in a measurement system refers to the ability of
an operator to consistently repeat a measurement with minimal
variation. Precision is how close the measurements are to each
other. The closer repeat measurements are to each other, the
less the variation. Accuracy is how close a measured value is to
the actual true value.
So the only
way you can obtain an accurate measurement is to take multiple
repeat measurements, calculate the average or mean value and
calculate the variation. An accurate measurement should have
minimal variation.
The Goldmann
tonometer only takes one measurement, and it is subjective
because the user has to line up the scale. So the measurement is
affected by the experience of the user and the subjective
alignment of the measurement scale, which causes measurement
bias. With only one measurement, it is not possible to determine
the accuracy of the measurement.
Other
tonometers also have the same issue. Multiple measurements must
be taken over time, averaged and the variation examined to
determine if the measurement is accurate.
Because
decisions are made based upon the measured value, it is
critically important that the measurement be repeatable, precise
and accurate.
Issue:
It is not possible to determine the accuracy of a measurement
with current tonometer technology. With only one measurement
value, the repeatability, precision and accuracy of the measured
value cannot be determined.
Solution: The FMAT1 device samples every millisecond for
multiple cardiac cycles. The sample data is analyzed for
repeatability, precision and accuracy. The mean and percent
variation is displayed to the user for his/her assessment.
4.
Transmission of Infectious Disease
Laboratory
studies have confirmed infectious prions in the tears of
individuals with Creutzfeldt – Jakob Disease (Mad Cow), HBV
virus in the tears of Hepatitis – B infected individuals, HCV
virus in the tears of Hepatitis – C infected individuals and
HTLV virus in the tears of individuals infected with the AIDS
virus, (Br J Med Res 2014 Apr 30;4(12):2322-2333, J Infect Dis
2012 Aug 15;206(4):478-485, J Clin Microbiol 1995 Aug 33(8):
2202-2203, Ophthalmology 1986 Dec 93;12:1479-1481). For these
potentially lethal diseases, the infectious agent is present in
the tears before the infected individual manifests the disease.
At this
time, Hepatitis-C is the leading cause of death among all
infectious diseases in the US, as reported by Kathleen N. Ly,
MPH, CDC Division of Viral Hepatitis, (Clinical Advisor, June
2016, Page 14).
Laboratory
studies examining the disinfection efficacy of different
regimens for tonometers have found that none are 100 % effective
at removal of the Hepatitis-B Virus, Hepatitis-C Virus and the
AIDS Virus. Studies also confirm that the infectious prions of
Creutzfeldt-Jacob Disease (Mad Cow) are resistant to all
conventional forms of sterilization, (Am J Ophthalmology 2001
Feb;131(2):184-187, Br J Med Res 2014 Apr 30;4(12):2322-2333,
Arch Ophthalmol 1994 Nov;112(11):1406-1407, Arch Ophthalmol 1989
Jul;107(7):983-985).
Studies done
in the United States on individuals with Creutzfeld-Jakob
Disease (Mad Cow) have confirmed that tonometry is a risk factor
for infection: Ocular Tonometry and Sporadic Creutzfeldt-Jakob
Disease: A Confirmatory Case-Control Study, Br J Med Res 2014
Apr 30;4(12):2322-2333. The study conclusion was that due to
lack of effective disinfection regimens and confirmation that
tonometry is a risk factor for infection, disposables are
required.
Issue:
Lethal infectious agents of Hepatitis B, Hepatitis C, AIDS and
Creutzfeld-Jakob (Mad Cow) Disease are present in tears.
Disinfection regimens, even if they are followed, do not
eliminate these pathogens.
Additionally, contact tonometers can be used without
confirmation of disinfection. They can also be used with or
without disposable covers. There is no absolute requirement that
they must be disinfected before use, or that a disposable cover
is used, or that the disposable cover has been changed after it
has been used. There is also no means of preventing reuse of a
disposable cover or disposable probe.
Air-puff tonometry once thought to be the solution, is not. It
is also a risk factor for transmission of infectious disease.
Laboratory studies have demonstrated that the puff of air
disperses the tear layer causing micro-aerosol formation. “The
ease with which droplets, potentially contaminated with human
immunodeficiency virus and other viruses, are dispersed is
disturbing. Air-puff tonometry may not be aseptic as previously
presumed”, (Microaerosol Formation in Non-Contact Air Puff
Tonometry. Britt JM, et al. Arch Ophthalmol 1991
Feb;109(2):225-228)
The
micro-aerosols are dispersed in a cloud which are inhaled,
deposited on external surfaces and deposited on the external
surface of the eye. This creates the potential transmission of
infection to not only other patients from contaminated surfaces
but directly to staff from inhalation of the infectious
micro-aerosols or deposition on the ocular surface.
Solution: The FMAT1 device uses a disposable plastic prism. The
prism must be changed before a measurement can be performed on a
different patient. The device has a detection system that is
able to determine if the prism has been used. It is an absolute
barrier to the transmission of infectious disease.
The
information in this article is the property of Falck Medical,
Inc., 07/16/16 Copyright 2016
Scientific
Advisory Board Members:
Francis Y. Falck, Jr., MD, PhD, MS, Assistant
Clinical Professor, University of Connecticut School of
Medicine
James Martone, MD, Assistant
Professor, Department of Ophthalmology, Yale University
Elias Reichel, MD, Vice Chairman,
Department of Ophthalmology, Tufts University School of
Medicine
Research Presentations with Falck Medical, Inc
Technology:
Clinical Comparison of the Falck Medical
Tono-Ophthalmodynamometer (FAT Model 1) to
Calibrated Weight Indentation Tonography. Agency for
Healthcare Research and Quality. Department of Health and
Human Services. Comparative Effectiveness of Screening for
Glaucoma. 01/04/2011.
Clinical Comparison of
the Falck Applanation Tonometer (FAT Model 2) to Goldmann
Applanation Tonometer. Agency for Healthcare Research and
Quality. Department of Health and Human Services.
Comparative Effectiveness of Treatment of Glaucoma.
01/04/2011.
Macular Society Meeting, 02/2010. Anti-VEGF
Injections Decrease Ocular Perfusion Pressure.
Association in Research in Vision and Ophthalmology
Meeting, 05/2010. Anti-VEGF Injections and Ocular
Perfusion Pressure.
World Forum 2010, Cambridge
University, 08/2010. Strategies for Preventing Blindness.
World Glaucoma Congress, Paris, France , 07/2011.
Anti-VEGF Injections Independently Increase Intraocular
Pressure and Decrease Ocular Perfusion Pressure.
Association for Research in Vision and Ophthalmology,
05/2000. Falck Medical Applanation Tonometer Intraocular
Pressure Measurements, Corneal Thickness and Corneal
Curvature.
Dr. Francis Falck, Chief Executive Officer,
Falck Medical, Inc received the “2010 Man of the Year in
Medicine and Healthcare Award” at the World Forum 2010,
Cambridge University, Cambridge, England on August 18th,
2010.
Dr. Falck was recognized for his milestone
work developing diagnostic technology that will be used
worldwide to prevent blindness and stroke.
The
World Forum 2010 was attended by 150 scholars from 40
different countries. |